Note
Go to the end to download the full example code.
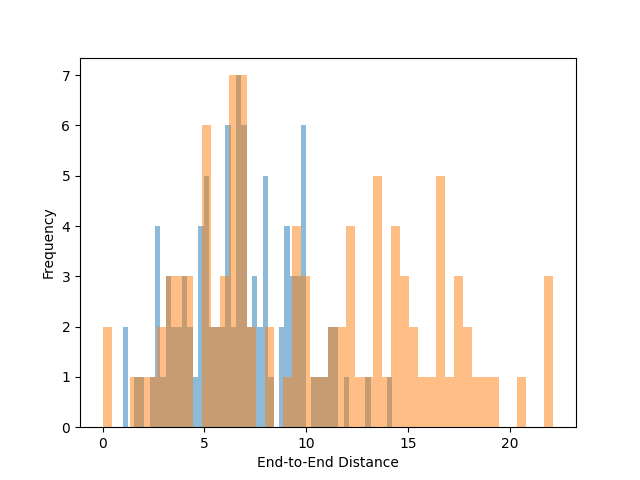
End-to-End Distribution
This example demonstrates how to analyze the end-to-end distribution of polymer chains using pylimer-tools. It reads a structure file, computes the end-to-end distances, and plots the distribution of these distances.
import os

import matplotlib.pyplot as plt

from pylimer_tools.io.read_lammps_output_file import read_data_file
from pylimer_tools_cpp import Universe

# Replace with your crosslinker type
crosslinker_type = 2

# Load your network (replace path accordingly)
universe = read_data_file(
    os.path.join(
        os.getcwd(),
        "../..",
        "tests/pylimer_tools/fixtures/structure/network_100_a_46.structure.out",
    )
)
assert isinstance(universe, Universe)

# Compute end-to-end distances for all chains,
# including crosslinkers.
# Two options are available:
end_to_end_distances_derived = [
    m.compute_end_to_end_distance_with_derived_image_flags()
    for m in universe.get_chains_with_crosslinker(crosslinker_type)
]
end_to_end_distances = [
    m.compute_end_to_end_distance()
    for m in universe.get_chains_with_crosslinker(crosslinker_type)
]

# Plot the end-to-end distance distribution
plt.figure()
plt.hist(
    end_to_end_distances_derived,
    bins=50,
    alpha=0.5,
    label="End-to-End Distances (Derived Image Flags)",
)
plt.hist(
    end_to_end_distances,
    bins=50,
    alpha=0.5,
    label="End-to-End Distances (Original Image Flags)",
)
plt.xlabel("End-to-End Distance")
plt.ylabel("Frequency")
plt.show()
Total running time of the script: (0 minutes 0.125 seconds)