Note
Go to the end to download the full example code.
Histogram Reader
Process histogram data from fix ave/hist commands.
import os
import matplotlib.pyplot as plt
from pylimer_tools.io.read_lammps_output_file import read_histogram_file
file_path = os.path.join(
os.getcwd(),
"../..",
"tests/pylimer_tools/fixtures/example_vec_avg_file.out.vec-avg.txt",
)
# Read histogram data
histogram_data = read_histogram_file(file_path)
# Plot histogram for specific timestep
final_timestep = histogram_data["TimeStep"].max()
final_hist = histogram_data[histogram_data["TimeStep"] == final_timestep]
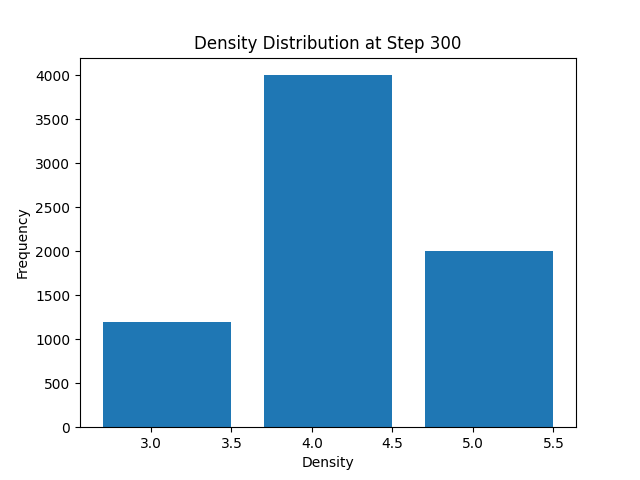
plt.bar(final_hist["value1"], final_hist["value2"])
plt.xlabel("Density")
plt.ylabel("Frequency")
plt.title(f"Density Distribution at Step {final_timestep}")
plt.show()
Total running time of the script: (0 minutes 0.061 seconds)