Note
Go to the end to download the full example code.
Time-Averaged Data Reader
Read output from LAMMPS fix ave/time commands.
Relevant documentation: read_averages_file()
and read_sectioned_averages_file()
Supported averaging formats:
Scalar quantities (single values per output timestep)
Vector quantities (multiple values per output timestep)
Multi-section files with varying column structures
Timestep 100: 3 data points
Timestep 200: 3 data points
Timestep 300: 3 data points
import os
from pylimer_tools.io.read_lammps_output_file import read_averages_file
averages_file = os.path.join(
os.getcwd(),
"../..",
"tests/pylimer_tools/fixtures/example_avg_file.out.avg.txt",
)
# Read simple averages file
averages = read_averages_file(averages_file)
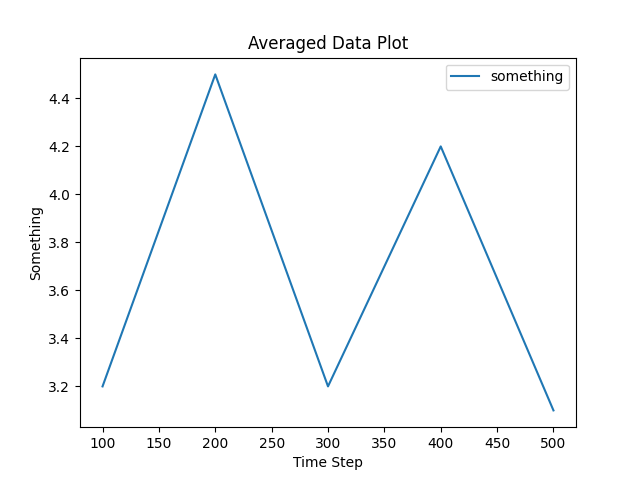
# Plot "TimeStep" vs "something"
averages.plot(
x="TimeStep",
y="something",
xlabel="Time Step",
ylabel="Something",
title="Averaged Data Plot",
)
vec_averages_file = os.path.join(
os.getcwd(),
"../..",
"tests/pylimer_tools/fixtures/example_vec_avg_file.out.vec-avg.txt",
)
# Read sectioned averages
# (e.g., from vector quantities from e.g. ``fix ave/time ... vector``)
sectioned_data = read_averages_file(vec_averages_file)
# Group by timestep for sectioned data
for timestep, group in sectioned_data.groupby("TimeStep"):
print(f"Timestep {timestep}: {len(group)} data points")
Total running time of the script: (0 minutes 0.068 seconds)